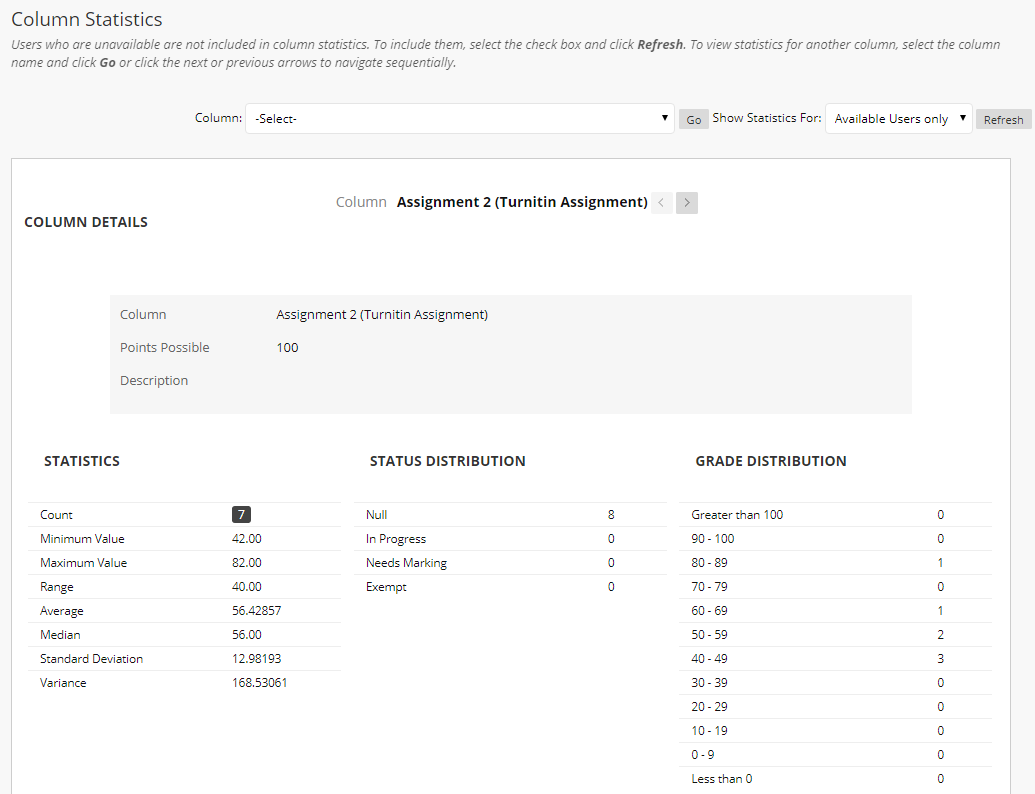
You can access statistics for any Blackboard Grade Centre column. The statistics available include average, median, standard deviation and how the grades are distributed.
Viewing Statistics for a Grade Centre column
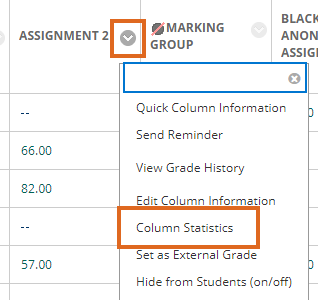
Click on the chevron icon and select Column Statistics.

The statistics display on screen. They can be copied and pasted into Word or Excel.

View Statistics for a Group
If Groups were set up to assign markers to papers, then statistics can be viewed by each Group – and therefore by marker.
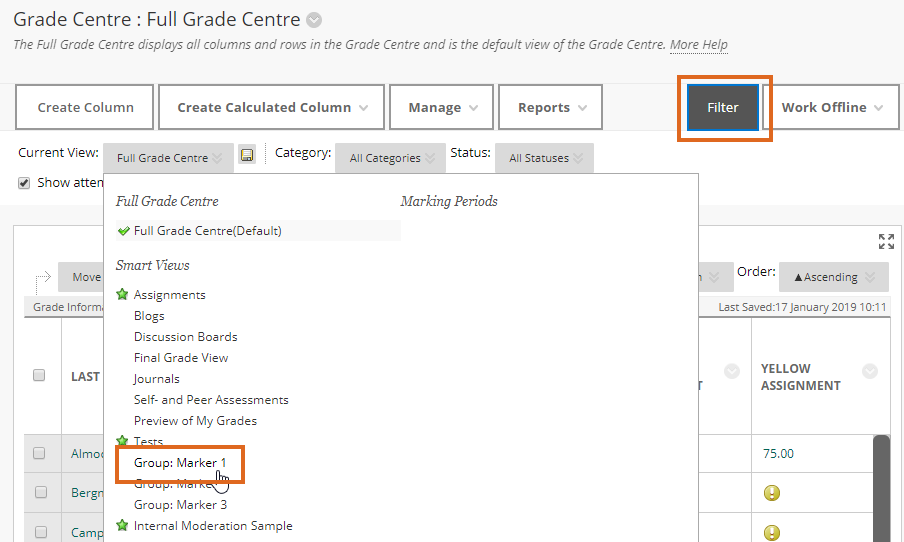
- If you have not already done so, set up a Smart View for each Group.
- In the Full Grade Centre, click Filter. Select the Group from the list of Smart Views.

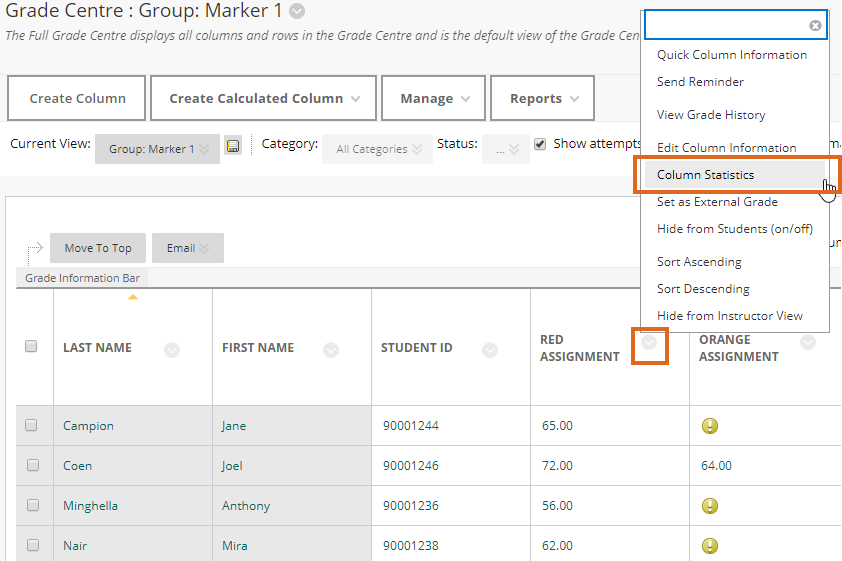
- Now from the contextual menu for the column, select Column Statistics.

- Statistics for the selected Group are displayed

Page last updated on March 7, 2019 by andyturner
You must be logged in to post a comment.