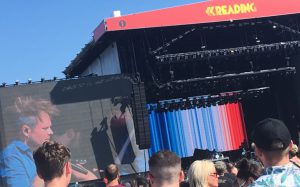
The stark reality of global warming was impossible to ignore at this year’s festival when the University of Reading’s climate stripes were displayed on the big screen of the main stage by Enter Shikari frontman, Rou Reynolds.
During the band’s set this Sunday, when weekend temperatures soared to a whopping 32 degrees, Rou Reynolds displayed the powerful graphic created by world-leading climate scientist, Professor Ed Hawkins.
In a passionate speech, Reynolds described the image as “one of the most defining, one of the most crucial, images of our time.”
He praised the University of Reading’s climate research and encouraged fans to “spread truth like this as far and as wide as we can.”
Professor Hawkins tweeted his thanks to the band for “communicating so effectively about climate change during your festival performances this summer.”
He went on to say that it is “amazing to see #showyourstripes used like this.”
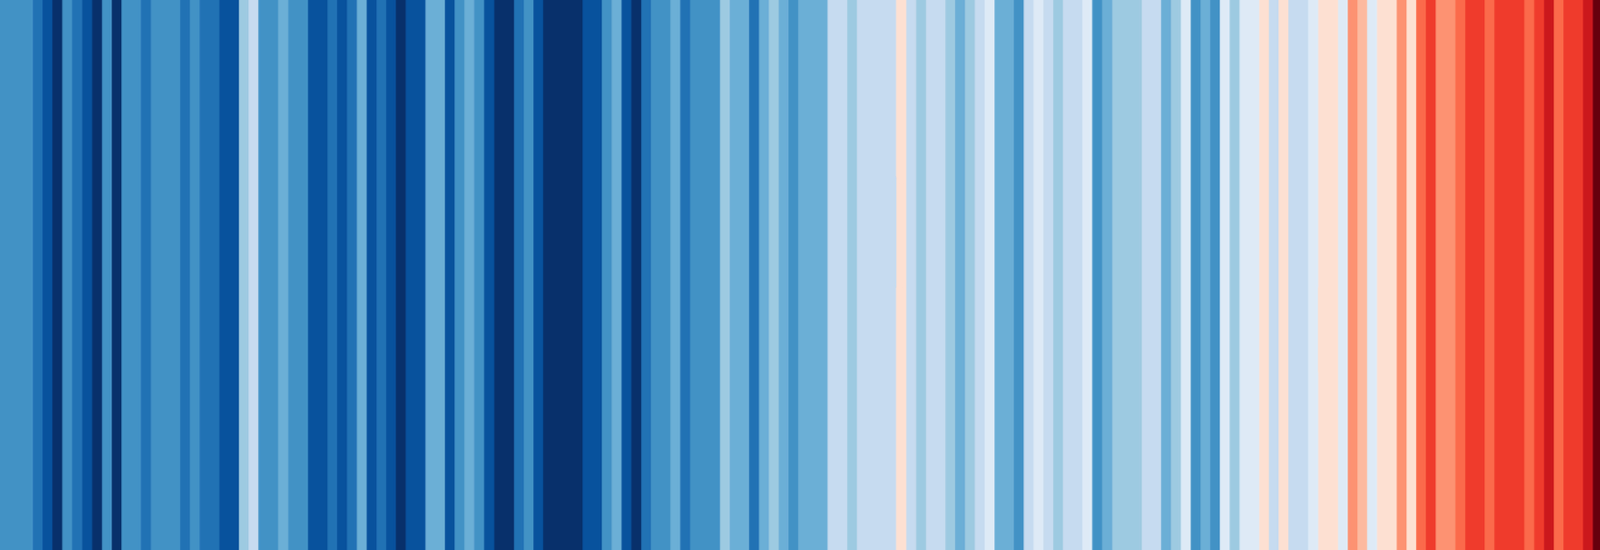
 The striking image shown by Enter Shikari is part of a series of climate graphics created by Professor Hawkins. The graphics plot average temperatures for each year since 1850 and visually demonstrate how temperatures have risen in every corner of the globe. Blue stripes represent cooler temperatures and red stripes represent hotter years. The thick band of deep red stripes that appear on the right hand side of the graphics act as a stark warning of how human action has contributed to a heating up of the climate over time.
#madeatreading campaign
In June 2019, Reading held a week long #madeatreading celebration of its world-class environmental research and action, which culminated in a ‘Show Your Stripes Day’ to raise awareness of the pervasive reality of global warming. Shareable graphics were available to download for use on social channels, and a striking range of climate stripes clothing was designed and is still available to buy online.
Professor Hawkins said: “Scientists measure global temperatures and draw graphs of heat building up over time, yet no individual person can ever experience average global warming.
“By showing just how temperatures have risen in every single country and every single state on the planet, it shows people that this is a worldwide phenomenon from which there is nowhere to hide. We really are all in this together.
“I would urge anyone who cares about the future of our planet to check out the stripes for their region and share it with others. It’s a powerful way to show what we humans have already done to the climate in our respective home countries. If we want to avoid heating up our homes even further, we must act quickly.”
The University is a world leader in environmental research and is involved in many sustainability projects in the local community. Through its impressive carbon management plan, Reading is following an ambitious pathway of carbon reduction, having set a challenging emissions reduction target of 45% by July 2020, against a 2008/09 baseline. Earlier this year, it hit the 40% reduction target in its carbon footprint.
You can join the discussion using the hashtags #madeatreading and #showyourstripes